Don't Trust the Hype, Trust the Data: Inside Our AI Model Benchmark Platform
Our comprehensive benchmarking platform compares leading detection models—revealing that systematic testing delivers 97.9% accuracy versus marketing claims.
Don’t Trust the Hype, Trust the Data: Inside Our AI Model Benchmark Platform
The AI landscape is flooded with bold claims. Every week brings a new “state-of-the-art” model promising to revolutionize computer vision. But here’s the uncomfortable truth: most of these claims are never validated on your specific use case.
Deploying an untested model into production is a gamble. The consequences?
- Accuracy failures that slip past quality control
- Inefficient resource usage that inflates cloud costs
- Poor scalability that cripples production throughput
At Rosepetal, we believe in a different approach: data-driven model selection backed by systematic benchmarking. This post walks you through our benchmarking platform, shows you real results from comparing four leading detection models, and demonstrates why rigorous testing is non-negotiable for reliable AI deployment.
Why Benchmarking Matters for Your Business
Benchmarking isn’t an academic exercise—it directly impacts your bottom line.
- Accuracy = ROI: A 2% improvement in defect detection can save thousands in product recalls
- Resource Efficiency: Choosing the right model reduces compute costs by up to 87%
- Scalability Assurance: Know your performance envelope before production, not after
- Risk Mitigation: Evidence-based decisions eliminate deployment surprises
The difference between a “good enough” model and the optimal one often translates to significant operational savings and competitive advantage.
Our Benchmarking Platform: Multi-Dimensional Model Evaluation
We don’t just measure accuracy. Our platform evaluates models across multiple dimensions to give you the complete picture.
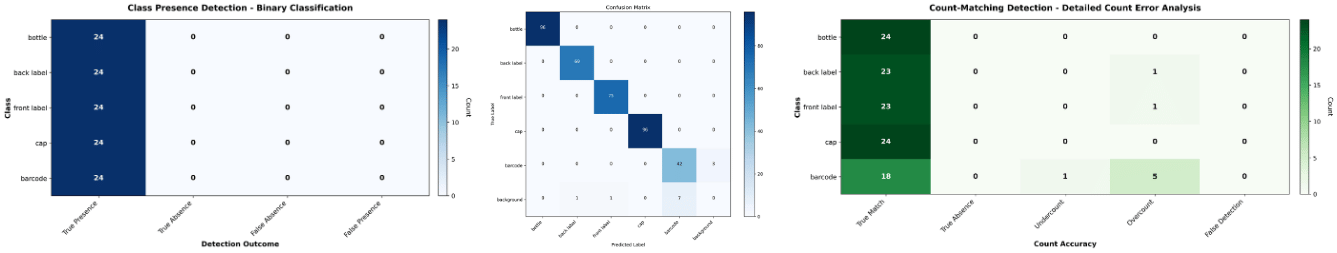
Accuracy Metrics: Beyond Simple Percentages
Every model is assessed using three complementary evaluation approaches:
- Instance Detection: Exact object localization with bounding box precision
- Presence Detection: Binary classification—is the object there or not?
- Count Matching: Does the model detect the correct quantity?
This multi-perspective analysis reveals where models succeed and where they fail. A model might excel at detecting objects but struggle with accurate counts—information that’s invisible in aggregate metrics alone.
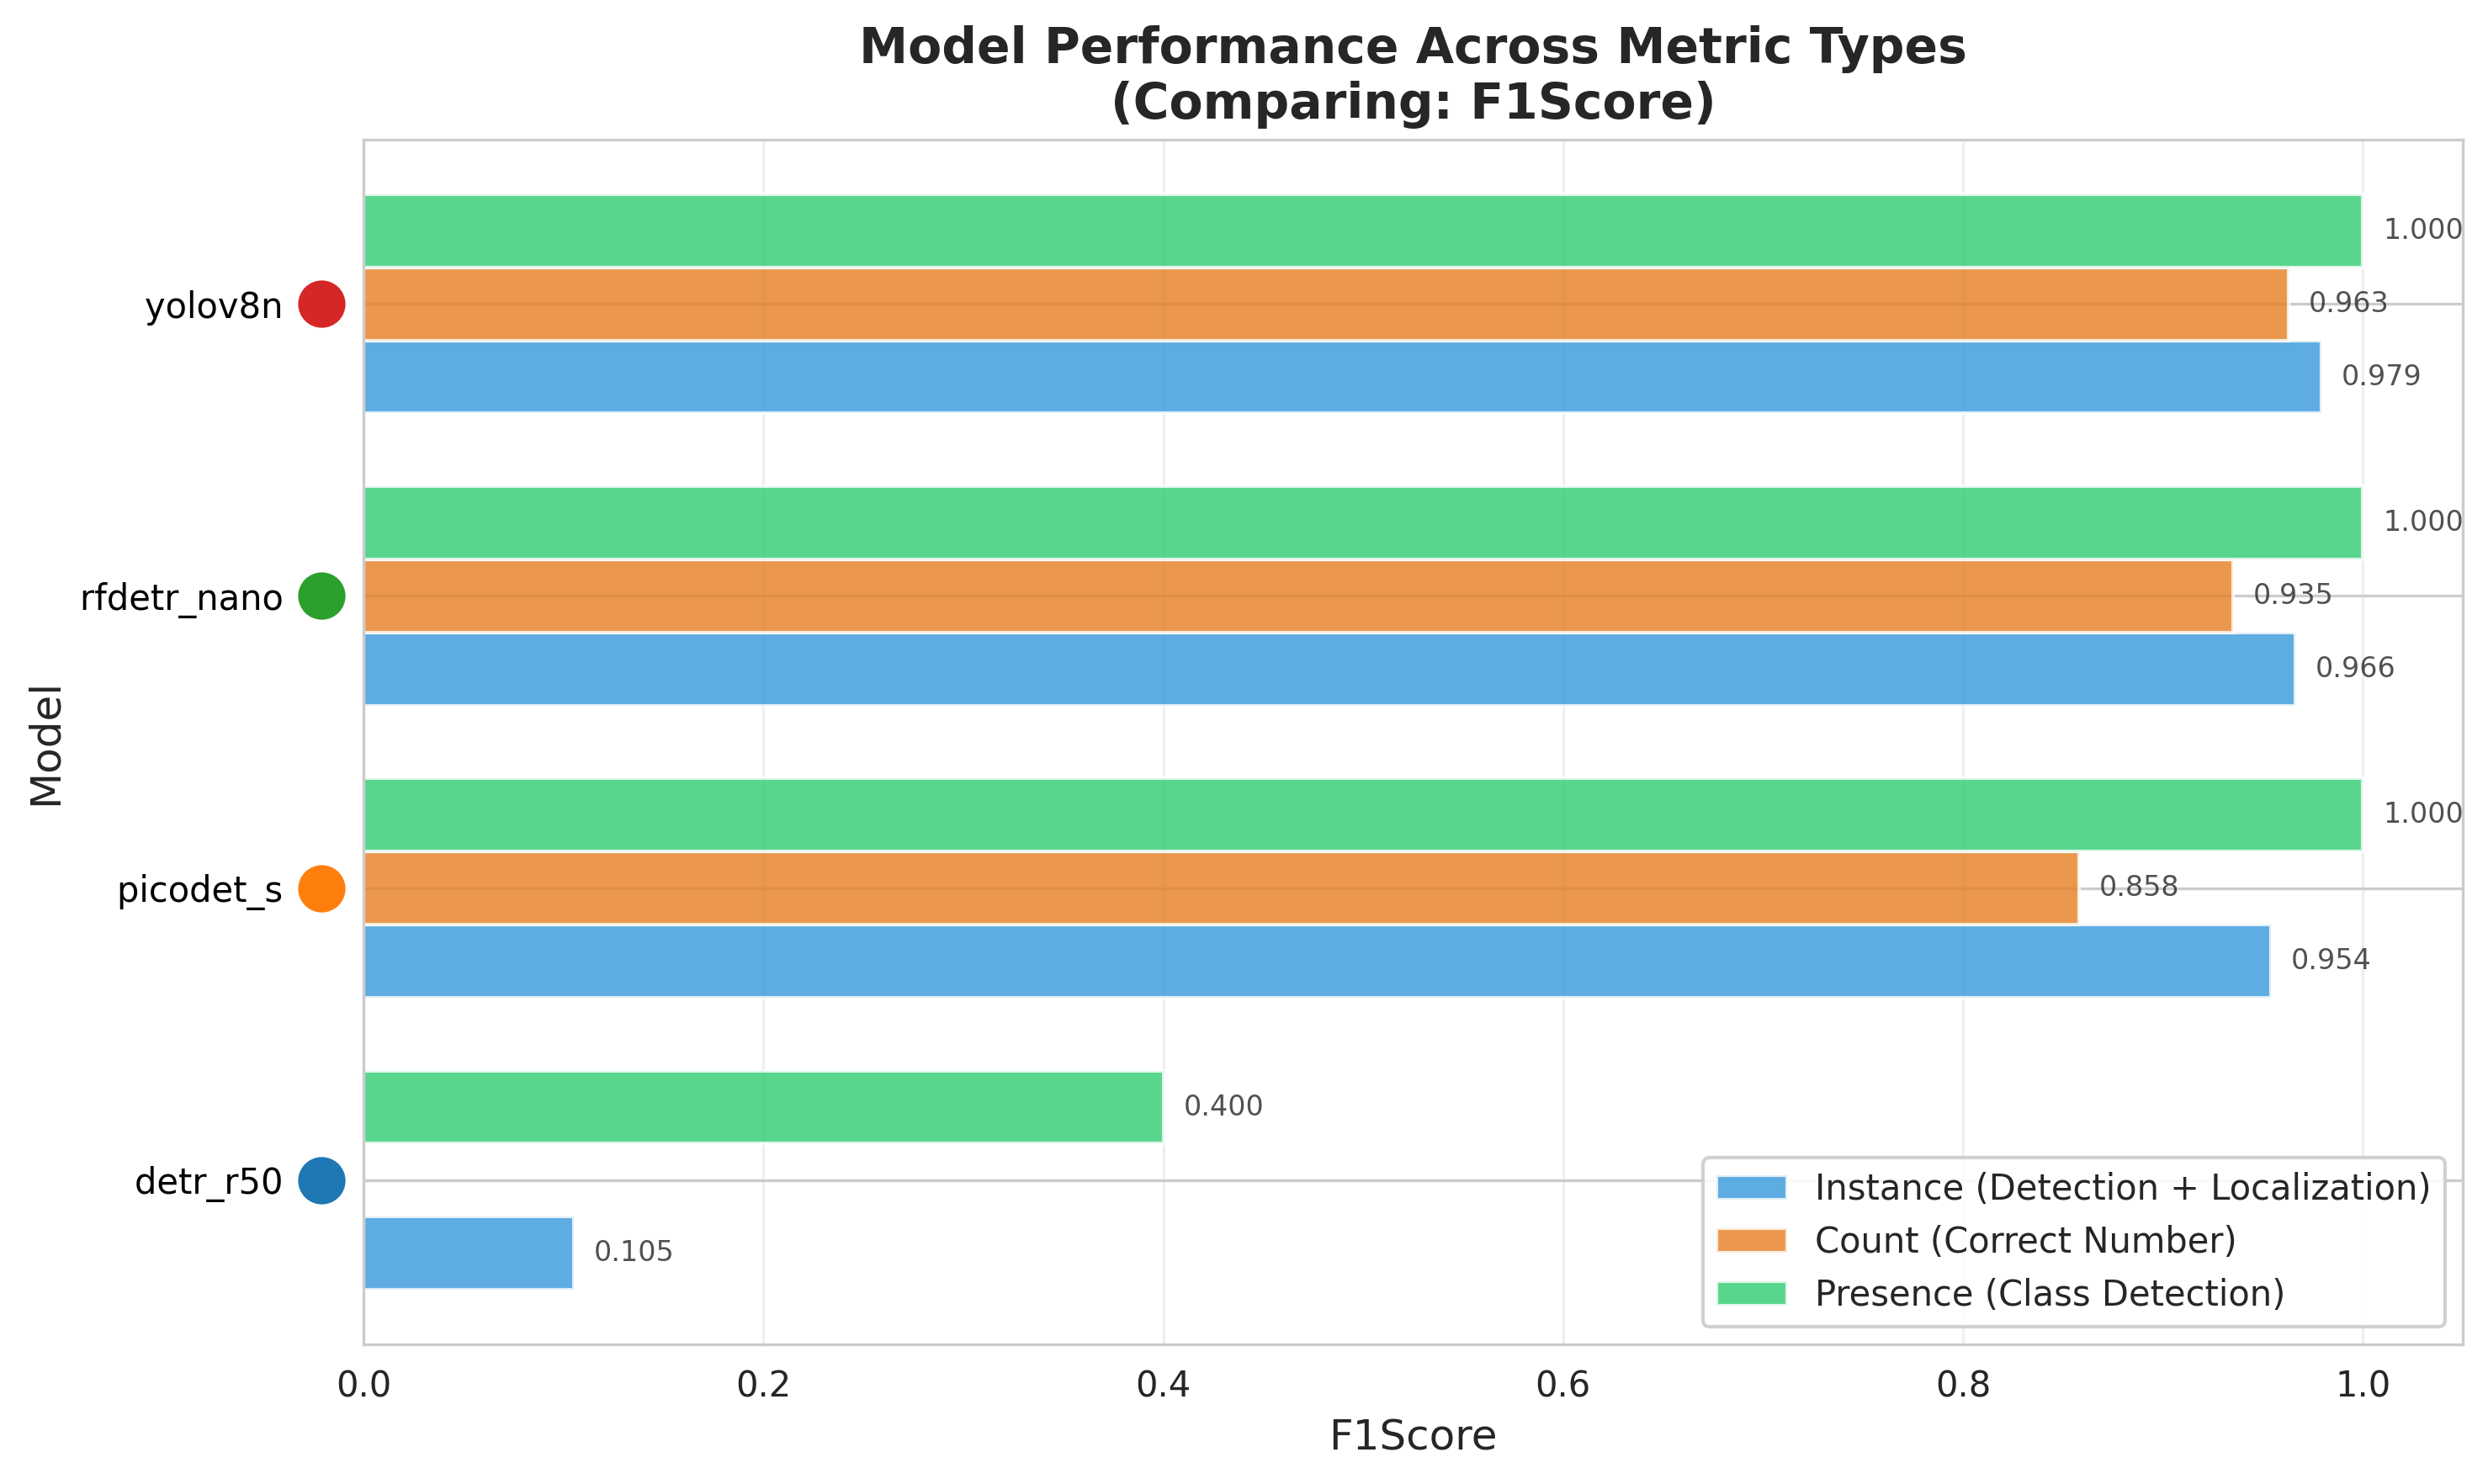
Performance Across Models
Our platform generates comprehensive comparisons across all tested models, showing F1 scores across different evaluation types:
Platform Capabilities
- Multi-Library Support: Test models from Rosepetal Detection Platform, PaddleX, HuggingFace VLM, and custom frameworks
- Automatic Dataset Conversion: Seamless testing across YOLO, COCO, and proprietary formats
- Domain-Specific Datasets: Real-world test sets that mirror your industry challenges—not just academic benchmarks
Result Analysis: Understanding Error Sources
Aggregate metrics tell you what happened. Our result analysis shows you why.
We compare predictions from every model side-by-side against ground truth, enabling systematic investigation of error patterns:
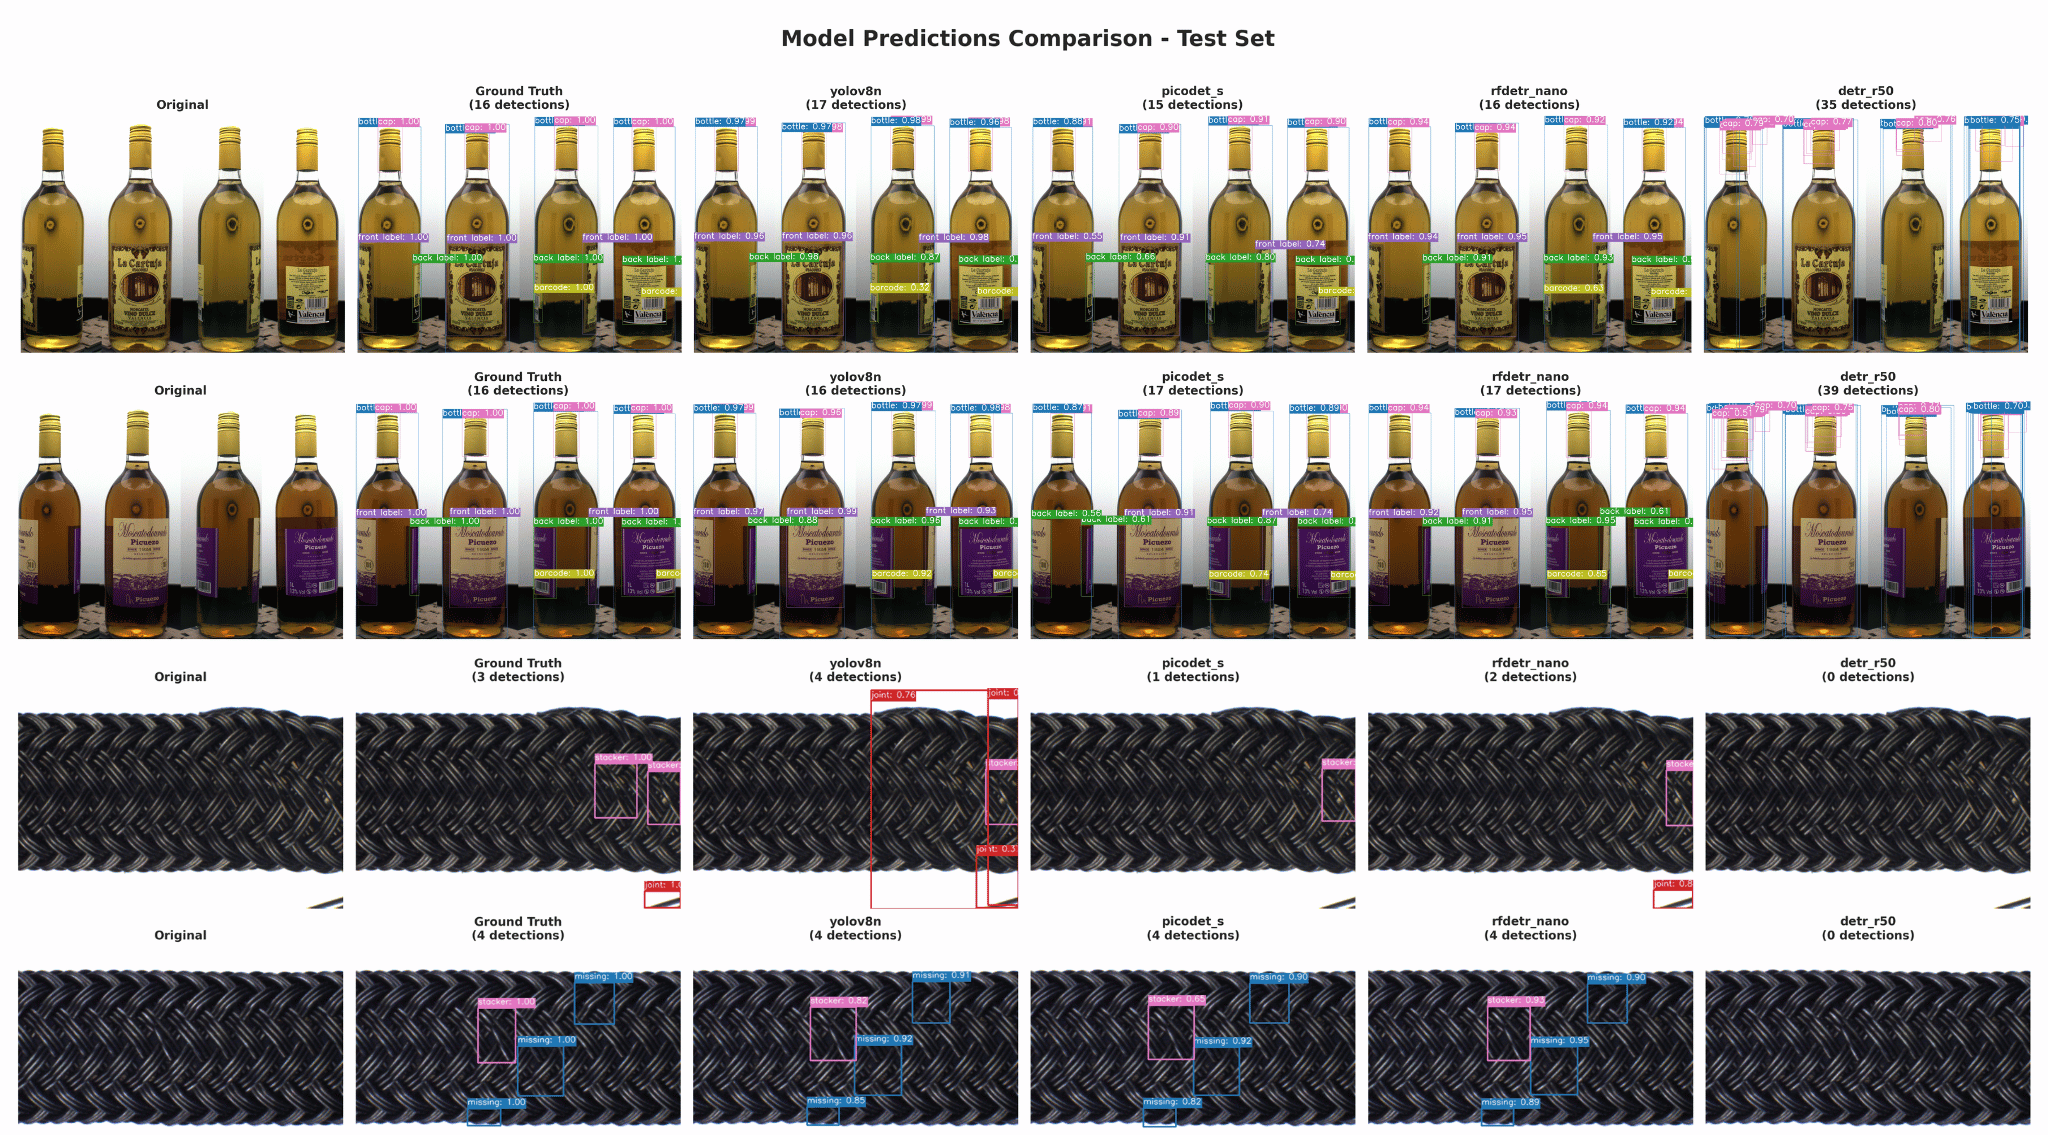
This visual comparison reveals critical insights:
- Which object types each model struggles with
- Whether errors are false positives (detecting things that aren’t there) or false negatives (missing real objects)
- Environmental factors affecting specific models (lighting, angles, occlusion)
Understanding error sources enables targeted model selection: if your use case is precision-critical (false positives are costly), you choose differently than if recall-critical (missed detections are costly).
Benchmark Results: Four Detection Models Compared
Let’s look at concrete data from a recent benchmark comparing four detection models on a bottle defect detection task.
Test Configuration
- Dataset: 120 images (80 train, 20 validation, 20 test) with 5 defect classes
- Hardware: NVIDIA RTX 4090
- Training: Standardized 100 epochs across all models
Models Tested
| Source | Model | Architecture |
|---|---|---|
| Rosepetal (rpdet) | YOLOv8 Nano | CNN-based, speed-optimized |
| Rosepetal (rpdet) | RFDETR Nano | Transformer-based detection |
| PaddleX | PicoDet-S | Efficient mobile detection |
| PaddleX | DETR-R50 | Original transformer detector |
Accuracy Results
| Model | Precision | Recall | F1-Score | Verdict |
|---|---|---|---|---|
| YOLOv8n (rpdet) | 96.9% | 98.9% | 97.9% | Best Overall |
| PicoDet-S (PaddleX) | 97.8% | 93.2% | 95.4% | High precision, lower recall |
| RFDETR Nano (rpdet) | 95.4% | 97.9% | 96.6% | Balanced performance |
| DETR-R50 (PaddleX) | 7.8% | 16.1% | 10.5% | Poor fit for this dataset |
Key Insights
- ✅ YOLOv8: Near-perfect detection with 98.9% recall—finds almost everything while maintaining 96.9% precision
- ✅ PicoDet-S: Highest precision (97.8%) but sacrifices recall—best when false positives are costly
- ✅ RFDETR Nano: Solid transformer-based alternative with balanced performance
- ⚠️ DETR-R50: Famous model, poor results—proof that benchmarking YOUR use case matters
The DETR-R50 result is particularly instructive. This model performs well on standard academic benchmarks (COCO) but failed dramatically on our industrial dataset. Marketing claims and academic performance don’t guarantee real-world success.
Performance and Efficiency
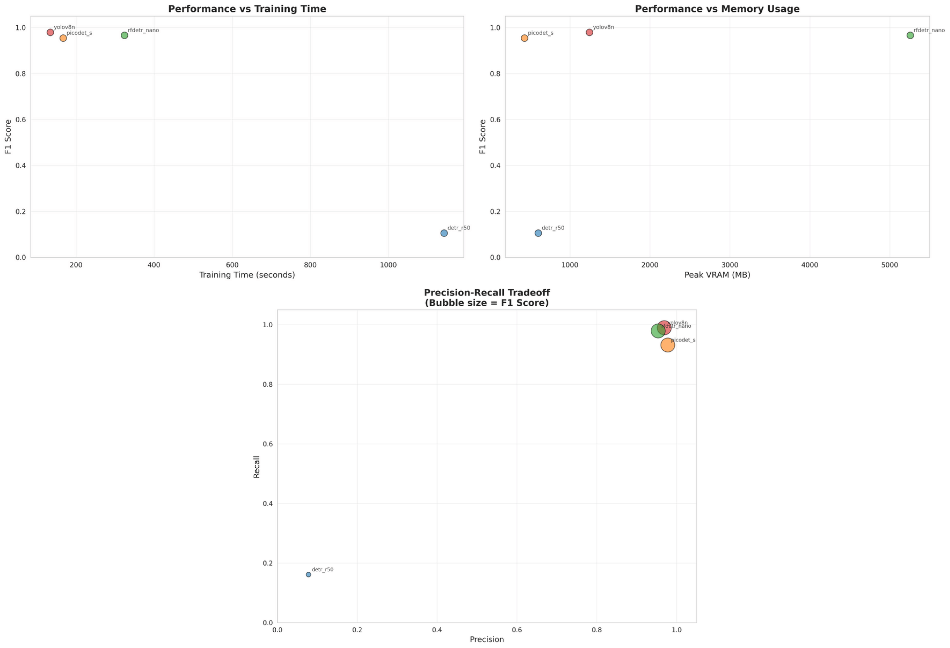
Beyond accuracy, production deployment requires understanding:
- Speed: YOLOv8 processes at 456 images/second—3.5x faster than PicoDet, 7.9x faster than DETR
- Resource Efficiency: YOLOv8 delivers the highest throughput per MB of GPU memory
- Latency Consistency: Tight p95/p99 bounds (17.7ms/17.9ms) enable reliable SLA commitments
Cost Impact Example: Processing 10 million images monthly:
- YOLOv8: ~6 GPU-hours
- DETR-R50: ~48 GPU-hours
- Potential savings: 87% reduction in compute costs
Our Testing Philosophy
Our benchmarking approach is built on four principles:
1. Domain-Specific Testing
Academic benchmark performance ≠ real-world performance. We test on datasets that mirror your industry challenges—manufacturing defects under varying lighting, retail products in cluttered environments, logistics packages in dynamic scenes.
2. Multiple Perspectives
Not just “accuracy” but development efficiency (can we iterate quickly?), production cost (cloud expenses), scalability (traffic spike handling), and reliability (consistent performance).
3. Transparency
We publish all metrics—including failures. The DETR result proves we test objectively. No cherry-picking favorable benchmarks.
4. Continuous Evolution
Benchmarking is ongoing. New models are tested as they emerge. Validation repeats when datasets change. We stay current so your deployments stay optimal.
What This Means for Your Projects
Deployment Confidence
- Before benchmarking: “Will this model work in production?”
- After benchmarking: “YOLOv8 delivers 97.9% accuracy at 456 img/sec with predictable latency”
Cost Optimization
Right model selection directly impacts infrastructure costs. Choosing YOLOv8 over DETR for this use case saves 87% in compute resources—real money at scale.
Custom Solutions
Every use case is different. We benchmark your data before committing to a solution:
- Need maximum speed? → Optimized architecture selection
- Need lowest memory footprint? → Efficiency-focused models
- Need specific accuracy/speed balance? → We test and recommend
Conclusion: Testing Today, Reliability Tomorrow
The AI model landscape will keep evolving. New architectures, new claims, new promises. What won’t change is the value of systematic, evidence-based testing.
Our benchmarking platform ensures that every model we deploy has earned its place through rigorous evaluation—not marketing hype.